Dashboard Manager by 3R ai

Dashboard Manager by 3R ai

Your Central Command for Real-Time Insights & Performance Tracking
A Product by xSOURCEe (OPC) Pvt. Ltd.

🔹 Overview

Dashboard Manager by 3R ai is a next-generation data visualization and performance monitoring platform that brings all your business, industrial, and operational data together on one intelligent screen.

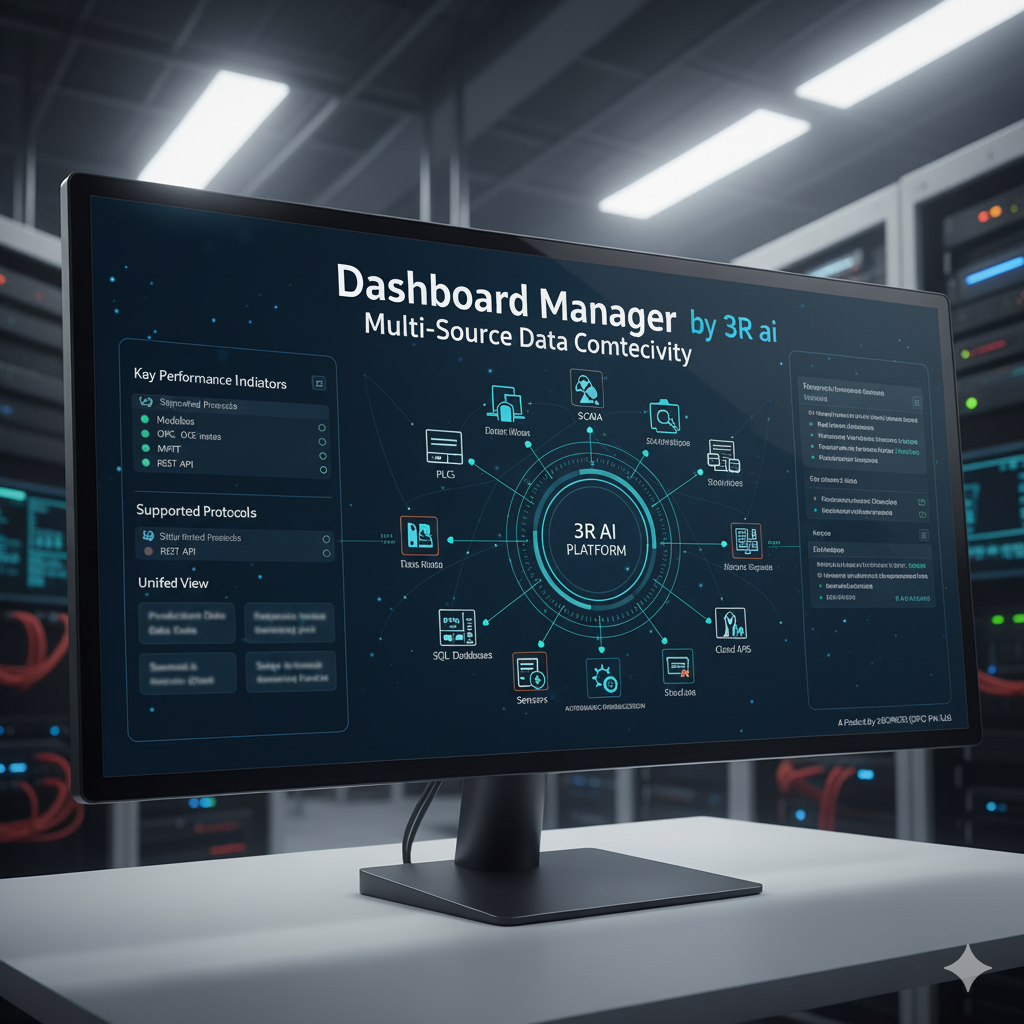
It seamlessly connects with software systems, databases, IoT devices, PLCs, SCADA, sensors, and ERPs, providing live dashboards that reflect your Key Performance Indicators (KPIs) in real-time.

Whether you manage a factory floor, business unit, or service team — Dashboard Manager gives you the clarity, control, and insight you need to make faster, smarter decisions.
1️⃣ Real-Time Data Visualization

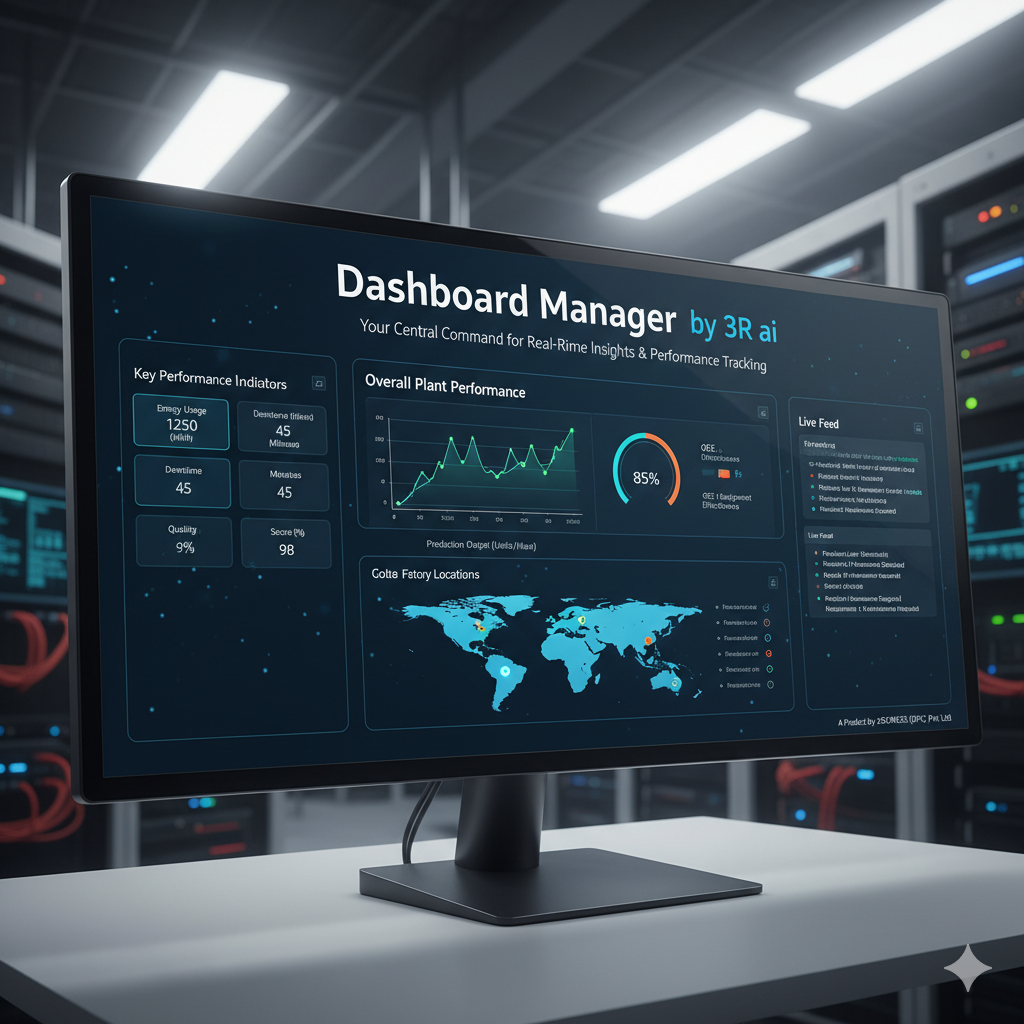
  • See your entire operation at a glance.
  • Plot dynamic charts, gauges, and analytics panels that update in real-time.
  • Display production rates, machine utilization, quality trends, energy usage, or sales performance.
  • Drag-and-drop widgets to build personalized dashboards for every department.
  • Visualize KPIs as bar charts, line graphs, dials, trendlines, or custom metrics.

2️⃣ Multi-Source Data Connectivity

  • Unify all your data pipelines into a single visual environment.
  • Direct integration with PLCs, SCADA systems, HMIs, ERP software, sensors, APIs, and SQL databases.
  • Collect data from multiple sources and normalize it automatically.
  • Support for Modbus, OPC, MQTT, REST API, and other industrial protocols.
  • Merge shop-floor data with business data (production + finance + sales).

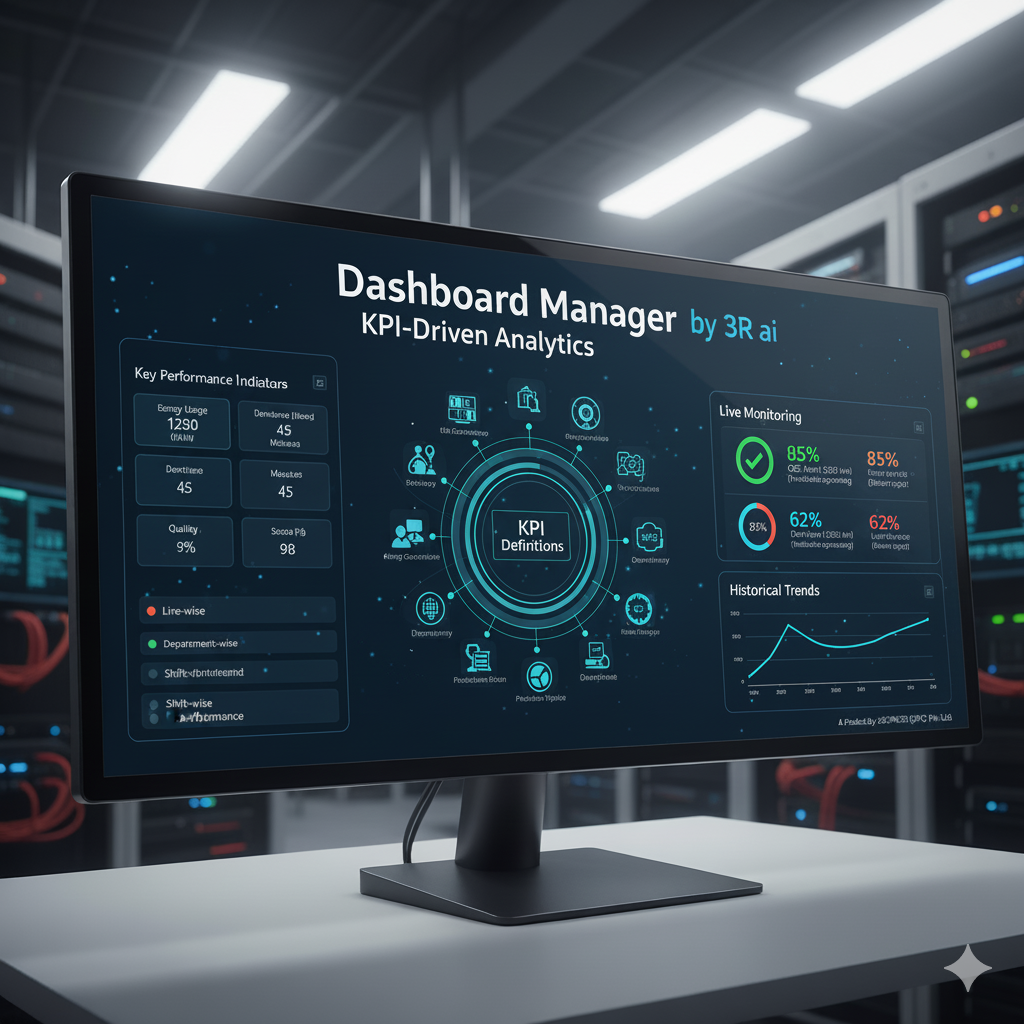
3️⃣ KPI-Driven Analytics

  • Focus on what matters most.
  • Define and customize Key Performance Indicators (KPIs) for different operations — like OEE (Overall Equipment Effectiveness), energy consumption, production efficiency, downtime, or output targets.
  • Set benchmark thresholds and receive visual alerts when KPIs deviate.
  • Compare real-time performance against historical trends.
  • Evaluate line-wise, department-wise, or shift-wise performance.

4️⃣ Custom Dashboard Designer

  • Empower users to create dashboards in minutes — no coding required.
  • Use drag-and-drop editor to add charts, cards, tables, or maps.
  • Group KPIs by department, location, or process.
  • Save and share dashboard templates across teams.
  • Apply your company branding, colors, and logos.

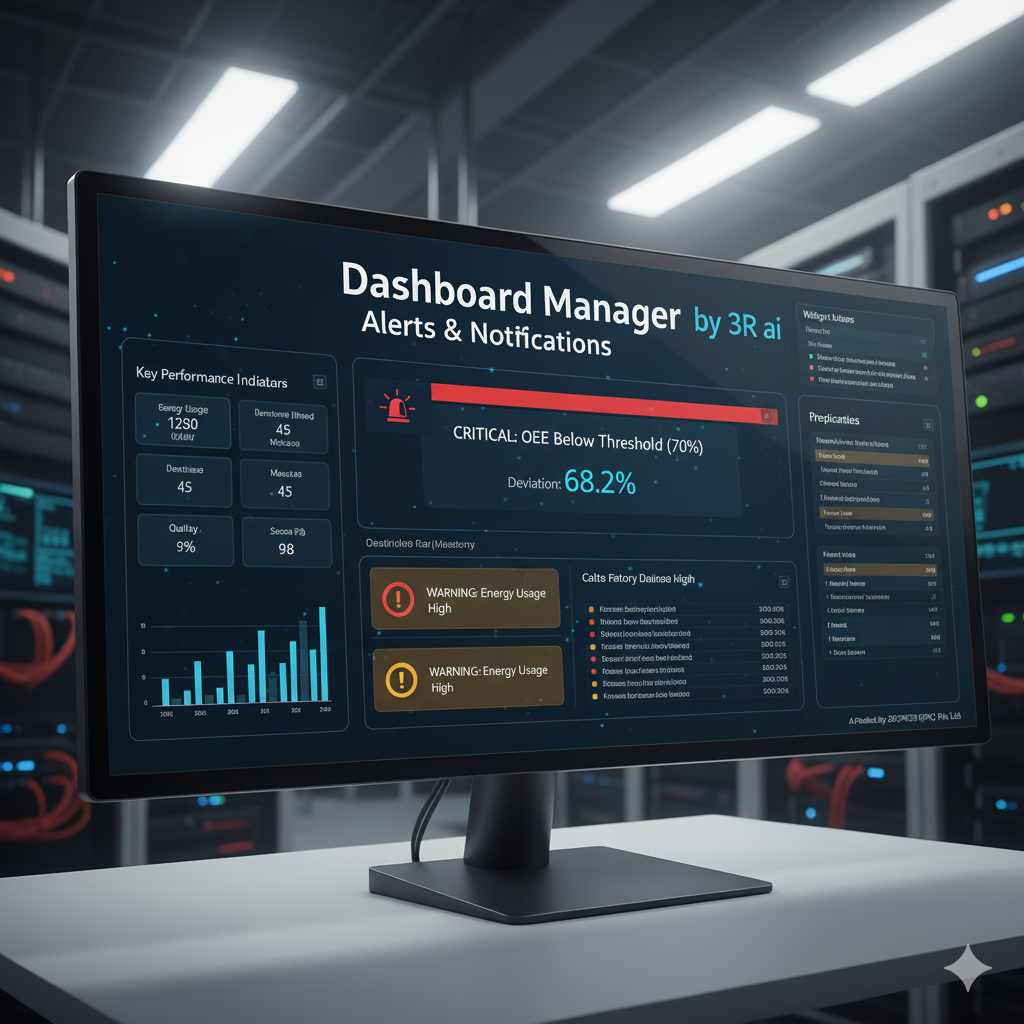
5️⃣ Alerts & Notifications

  • Never miss critical deviations.
  • Automated alerts for KPI breaches (via email, SMS, or on-screen).
  • Configurable thresholds and tolerance limits.
  • Visual color coding (green/yellow/red) for quick anomaly detection.
  • Notification history log with timestamped data.

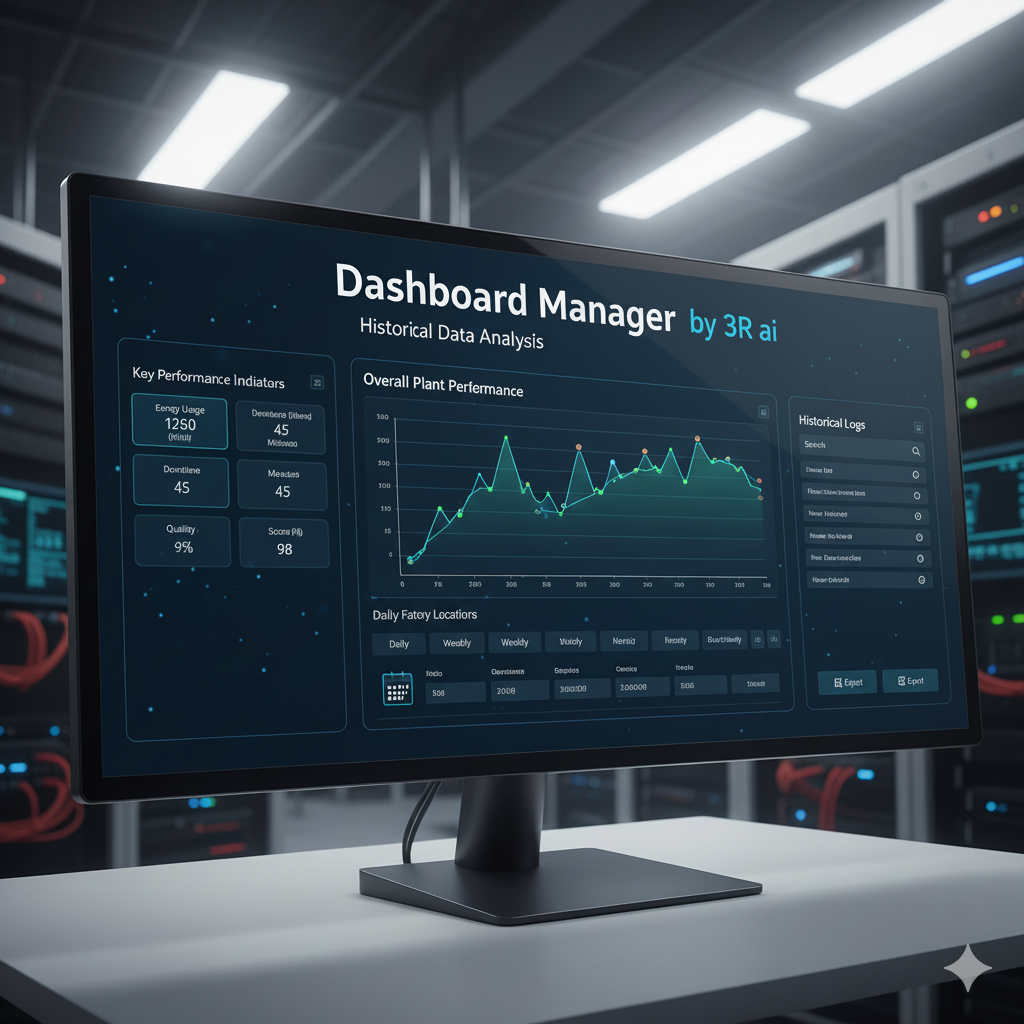
6️⃣ Historical Data Analysis

  • Track and analyze performance over time.
  • View trend lines for any KPI or metric.
  • Compare daily, weekly, or monthly performance.
  • Export charts or datasets to Excel, CSV, or PDF.
  • Use time-based filters to isolate shifts, machines, or product runs.

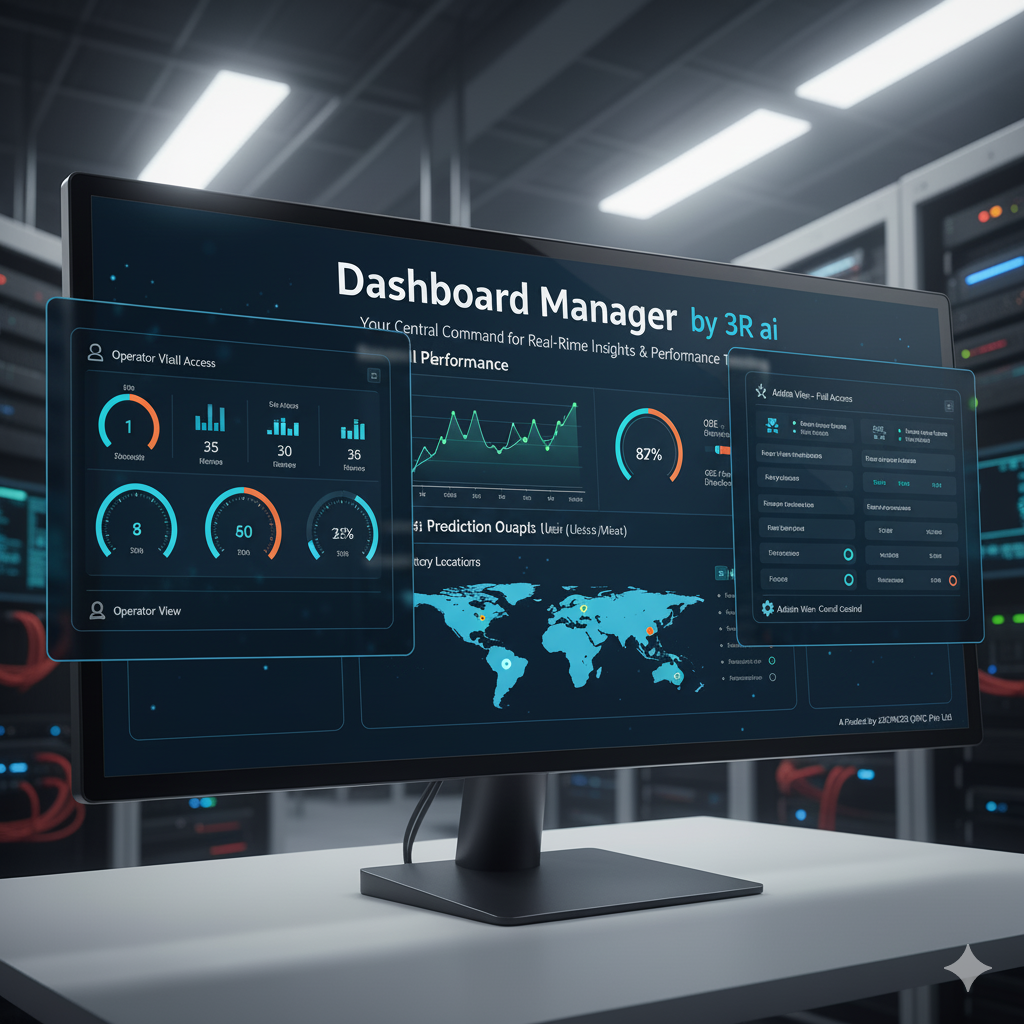
7️⃣ Multi-Level Access & Control

  • Assign different views for managers, engineers, and operators.
  • Secure user authentication and role-based permissions.
  • Department-specific dashboards for focused monitoring.
  • Central admin control to configure data sources and visualization rules.

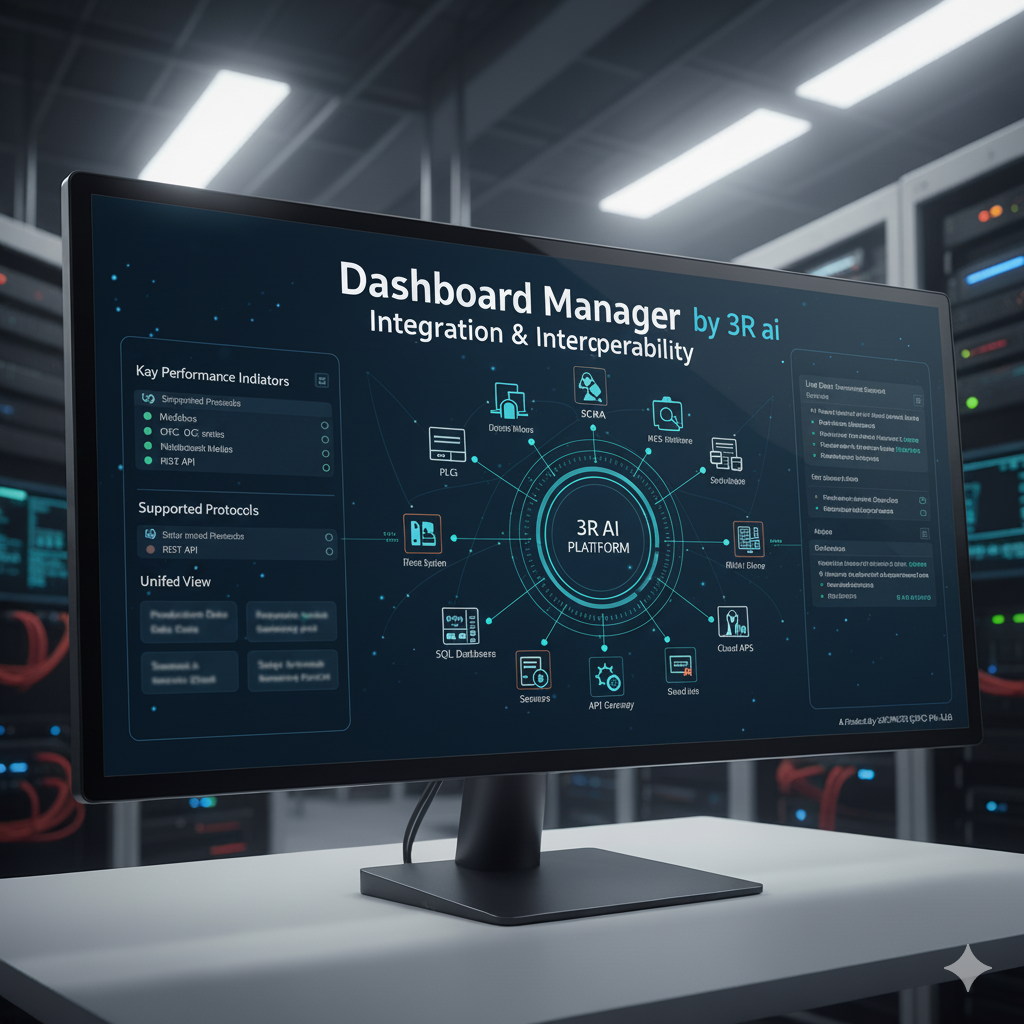
8️⃣ Integration & Interoperability

  • Easily extend functionality across your existing infrastructure.
  • Connect to ERP, MES, CRM, or HR systems for enterprise-wide visibility.
  • API support for real-time data exchange.
  • Compatible with industrial automation systems and cloud servers.

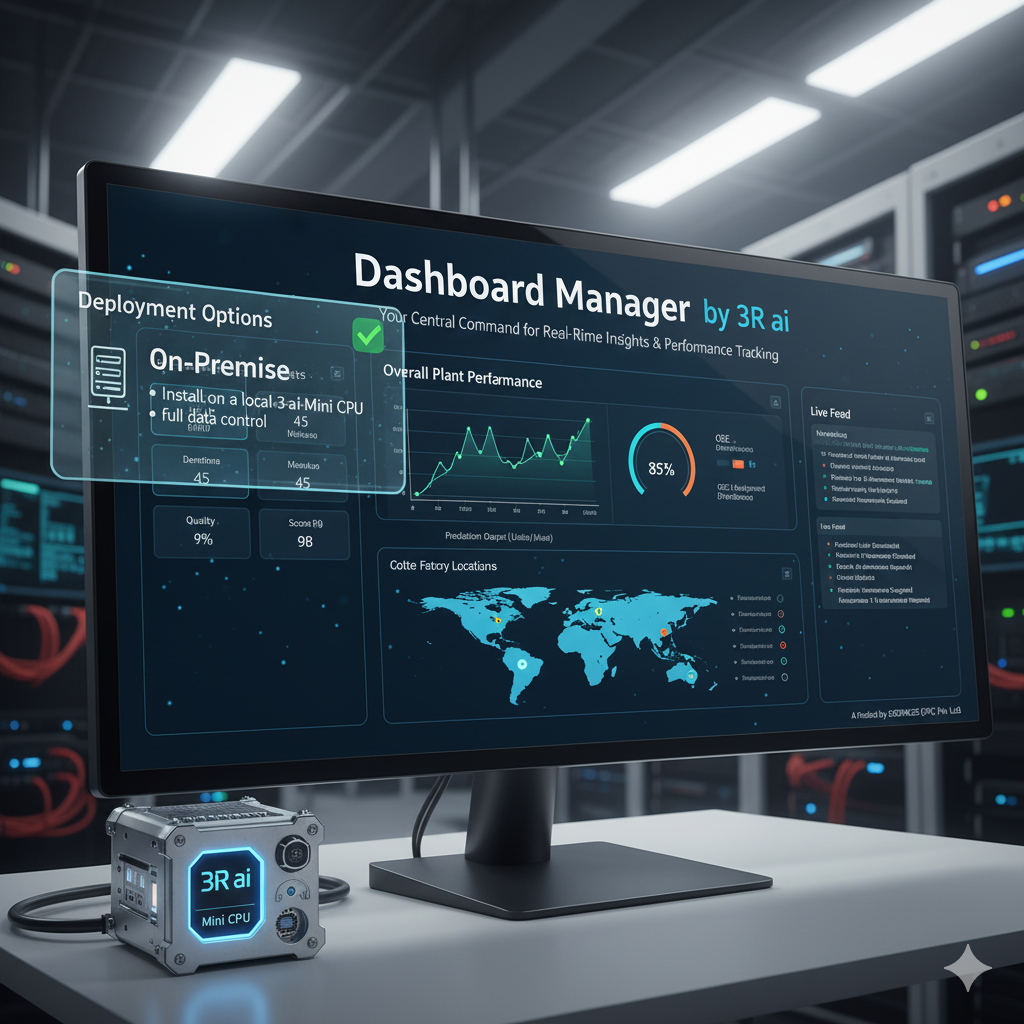
9️⃣ Deployment Options

  • Flexibility to suit your IT environment.
  • On-Premise: Install on a local 3R ai Mini CPU or server for full data control.
  • Hybrid: Local visualization + optional cloud analytics sync.
  • Offline Support: Works in real-time even without internet access.

💡 Why Choose Dashboard Manager by 3R ai

✅ Real-Time KPI Visualization
✅ Direct Connectivity with PLC, SCADA & Sensors
✅ Unified Data from Business & Industrial Systems
✅ User-Friendly Dashboard Builder
✅ On-Premise or Hybrid Deployment
✅ Secure, Scalable & Customizable

🧠 Use Cases

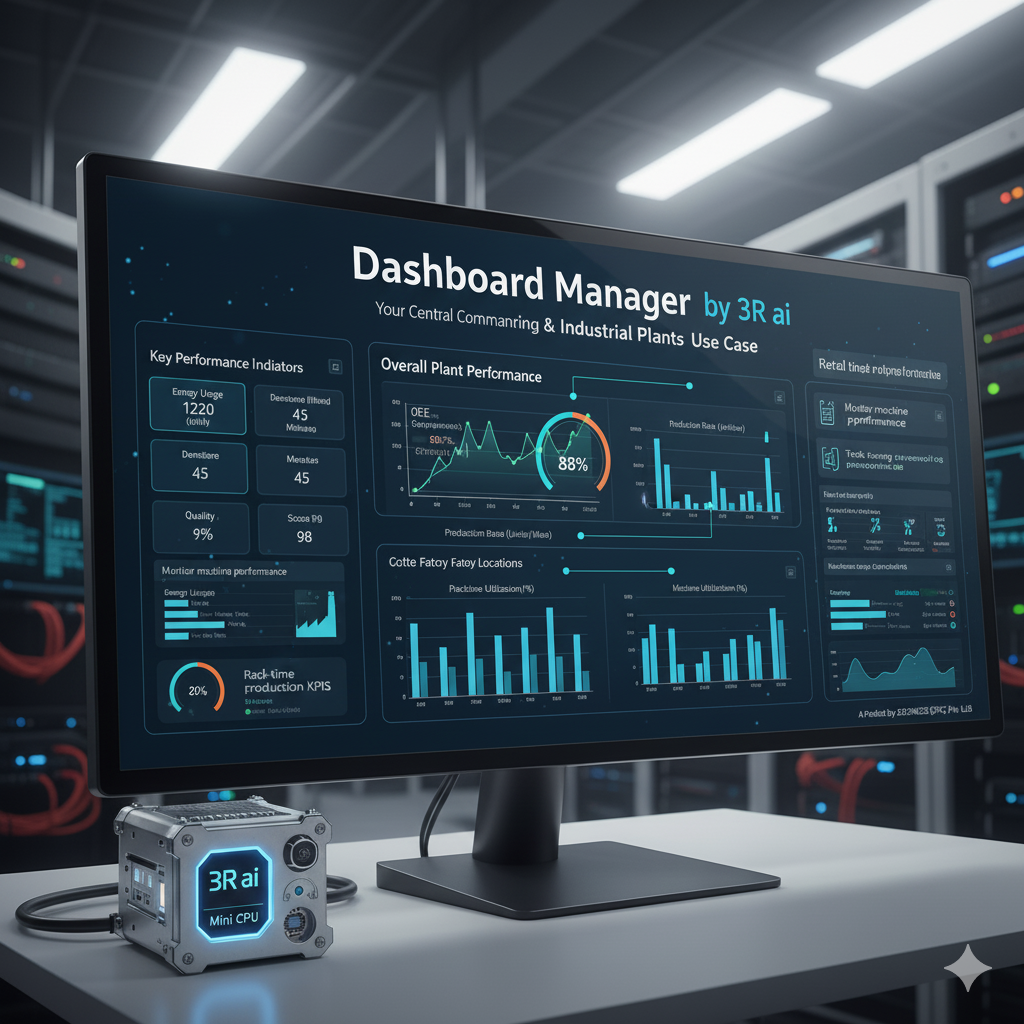
Manufacturing & Industrial Plants: Monitor machine performance, energy usage, production KPIs.

Smart Buildings & Facilities: Track temperature, lighting, and energy efficiency.

Retail & Business Operations: View sales, revenue, and customer satisfaction KPIs.

IT & Data Centers: Monitor server uptime, performance metrics, and error rates.

Project & HR Teams: Visualize task progress, employee attendance, and performance metrics.


For demo, pricing & installation:

Contact Us

Contact us

Partner with Us for Comprehensive IT

We’re happy to answer any questions you may have and help you determine which of our services best fit your needs. 

Your benefits:
What happens next?

We Schedule a call at your convenience 

We do a discovery and consulting meting 

We prepare a proposal 

Schedule a Free Consultation